scanpy.pl.embedding_density
- scanpy.pl.embedding_density(adata, basis='umap', key=None, groupby=None, group='all', color_map='YlOrRd', bg_dotsize=80, fg_dotsize=180, vmax=1, vmin=0, vcenter=None, norm=None, ncols=4, hspace=0.25, wspace=None, title=None, show=None, save=None, ax=None, return_fig=None, **kwargs)
Plot the density of cells in an embedding (per condition).
Plots the gaussian kernel density estimates (over condition) from the
sc.tl.embedding_density()output.This function was written by Sophie Tritschler and implemented into Scanpy by Malte Luecken.
- Parameters
- adata :
AnnData The annotated data matrix.
- basis :
str(default:'umap') The embedding over which the density was calculated. This embedded representation should be found in
adata.obsm['X_[basis]']`.- key :
Optional[str] (default:None) Name of the
.obscovariate that contains the density estimates. Alternatively, passgroupby.- groupby :
Optional[str] (default:None) Name of the condition used in
tl.embedding_density. Alternatively, passkey.- group :
Union[str,List[str],None] (default:'all') The category in the categorical observation annotation to be plotted. For example, ‘G1’ in the cell cycle ‘phase’ covariate. If all categories are to be plotted use group=’all’ (default), If multiple categories want to be plotted use a list (e.g.: [‘G1’, ‘S’]. If the overall density wants to be ploted set group to ‘None’.
- color_map :
Union[Colormap,str] (default:'YlOrRd') Matplolib color map to use for density plotting.
- bg_dotsize :
Optional[int] (default:80) Dot size for background data points not in the
group.- fg_dotsize :
Optional[int] (default:180) Dot size for foreground data points in the
group.- vmin :
Optional[int] (default:0) The value representing the lower limit of the color scale. Values smaller than vmin are plotted with the same color as vmin. vmin can be a number, a string, a function or
None. If vmin is a string and has the formatpN, this is interpreted as a vmin=percentile(N). For example vmin=’p1.5’ is interpreted as the 1.5 percentile. If vmin is function, then vmin is interpreted as the return value of the function over the list of values to plot. For example to set vmin tp the mean of the values to plot,def my_vmin(values): return np.mean(values)and then setvmin=my_vmin. If vmin is None (default) an automatic minimum value is used as defined by matplotlibscatterfunction. When making multiple plots, vmin can be a list of values, one for each plot. For examplevmin=[0.1, 'p1', None, my_vmin]- vmax :
Optional[int] (default:1) The value representing the upper limit of the color scale. The format is the same as for
vmin.- vcenter :
Optional[int] (default:None) The value representing the center of the color scale. Useful for diverging colormaps. The format is the same as for
vmin. Example: sc.pl.umap(adata, color=’TREM2’, vcenter=’p50’, cmap=’RdBu_r’)- ncols :
Optional[int] (default:4) Number of panels per row.
- wspace :
None(default:None) Adjust the width of the space between multiple panels.
- hspace :
Optional[float] (default:0.25) Adjust the height of the space between multiple panels.
- return_fig :
Optional[bool] (default:None) Return the matplotlib figure.
- show :
Optional[bool] (default:None) Show the plot, do not return axis.
- save :
Union[str,bool,None] (default:None) If
Trueor astr, save the figure. A string is appended to the default filename. Infer the filetype if ending on {'.pdf','.png','.svg'}.- ax :
Optional[Axes] (default:None) A matplotlib axes object. Only works if plotting a single component.
- adata :
Examples
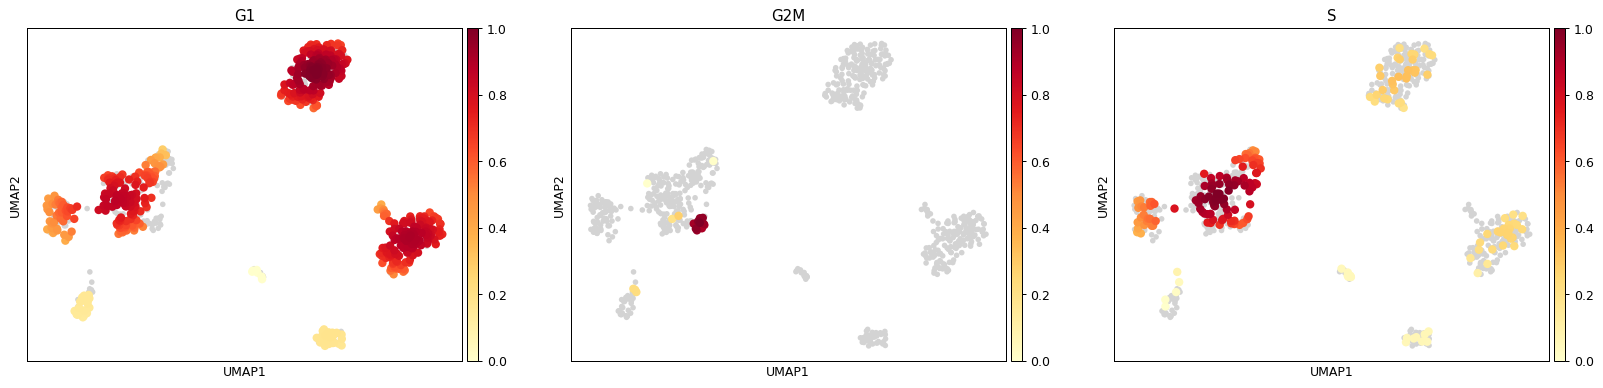
import scanpy as sc
adata = sc.datasets.pbmc68k_reduced()
sc.tl.umap(adata)
sc.tl.embedding_density(adata, basis='umap', groupby='phase')
Plot all categories be default
sc.pl.embedding_density(adata, basis='umap', key='umap_density_phase')
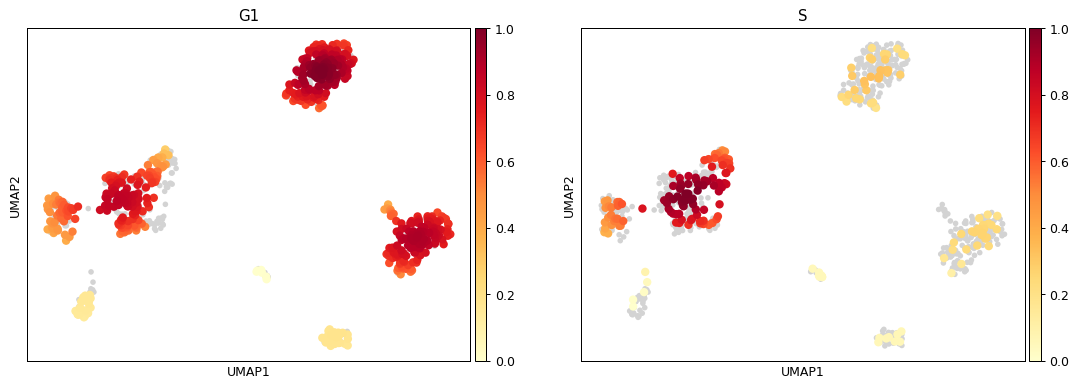
Plot selected categories
sc.pl.embedding_density(
    adata,
    basis='umap',
    key='umap_density_phase',
    group=['G1', 'S'],
)
See also